Is the U.S.
Surface Temperature Record Reliable?
By Anthony Watts
info@surfacestations.org
Surfacestations.org in association with
Heartland.org
Download PDF (28 pages, 4 MB)
Hardcopies may be
purchased through the Heartland Institute.
FAQs (150,000 copies were distributed)
{Editor: In light of the Cap and Trade
and Climate Change political agendas, this article is relevant and timely
regarding data fidelity and cognitive disonance. Please let the "law"
makers know they are being led down the wrong path based on manipulated data. A
gallery of "misplaced" weather stations can be seen at http://www.surfacestations.org/online_database.htmand and may be viewed in 3D using theCooliris plugin for Safari. Those in
charge at NOAA, National
Weather Service,
GISS and National Climatic Data Center have obviously been compromised by the Environmentalist
religionists.}
"The official record of temperatures in the continental
United States comes from a network of 1,221 climate-monitoring stations
overseen by the National Weather Service, a department of the National Oceanic
and Atmospheric Administration (NOAA). Until now, no one had ever conducted a
comprehensive review of the quality of the measurement environment of those
stations."
Your help is
needed to document the measuring environment and equipment condition of weather
and climate monitoring stations worldwide.
Anyone with a
digital camera, handheld GPS and basic observation and reporting skills can
contribute to this database.
To get
started, signup then view and/or download the instructions and site survey form from here of from the online image database
at gallery.surfacestations.org Then familiarize yourself with them, and then choose what
stations you want to survey and contribute to this database.
Full credit is
given to all contributors of photos and survey forms, or if you wish, you can
submit a survey anonymously.
All
submissions will be checked for accuracy.
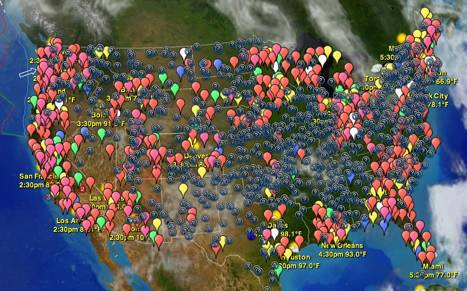
{Editor: To access the live Google Map, Google Earth
has to be installed and free registration needs to occur on the
Surfacestations.org Database page. The KML file is located at http://www.surfacestations.org/downloads/surfacestations%20ratings%20-%2020080912.kml and besides GoogleMaps, the file also opens in - EarthBrowser. The grey balloons in the map below are unsurveyed surface stations.}
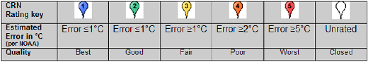
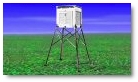
Class 1 (CRN1) - Flat and horizontal ground surrounded by a clear surface with a slope below
1/3 (<19deg). Grass/low vegetation ground cover <10 centimeters high.
Sensors located at least 100 meters from artificial heating or reflecting
surfaces, such as buildings, concrete surfaces, and parking lots. Far from
large bodies of water, except if it is representative of the area, and then
located at least 100 meters away. No shading when the sun elevation >3
degrees.
Class 2 (CRN2) - Same as Class 1 with the following differences. Surrounding Vegetation <25
centimeters. No artificial heating sources within 30m. No shading for a sun
elevation >5deg.
Class 3 (CRN3) (error >=1C) - Same as Class 2, except no artificial heating sources within
10 meters.
Class 4 (CRN4) (error >= 2C) - Artificial heating sources <10 meters.
Class 5 (CRN5)
(error >= 5C) - Temperature sensor located next to/above an artificial
heating source, such a building, roof top, parking lot, or concrete
surface."
"89 percent of the
stations--nearly 9 of every 10--fail to meet the National Weather Services own
siting requirements."
"With only 11% of surveyed
stations being of acceptable quality, the raw temperature data produced by the
USHCN stations are not sufficiently accurate to use in scientific studies or as
a basis for public policy decisions."
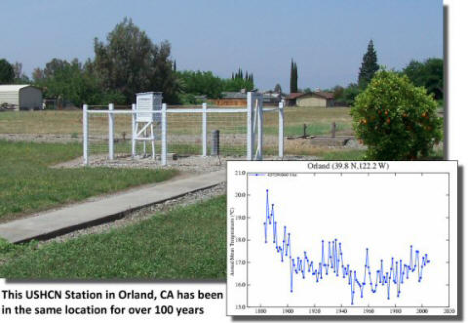
The
Orland USHCN station is located behind the Orland Water Users Association off
of 8th Street in Orland CA. It has the distinction of being well sited, and
having been in the same location for over 100 years. It also has not been badly
encroached upon by UHI as the community has not grown significantly during the
period.
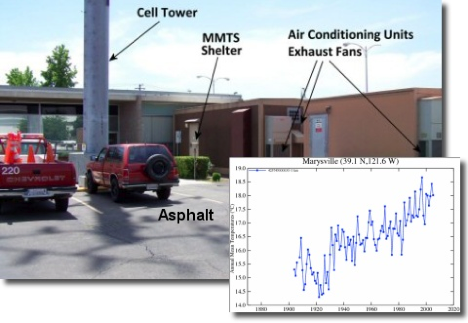
This site in
Marysville, CA has been around for about the same amount of time, but
has
been encroached upon by growth in a most serious way by micro-site effects.
I keep telling myself
that there probably arent many surprises left. Weve seen climate monitoring
stations in parking lots, next to parked cars, next to burn barrels, near air conditioners, at airports,
at sewage treatment plants, at industrial facilities, in peoples front yards, back yards, side yards, near BBQ grills,
on top of telephone poles, on main street, next to houses, attached to houses, next to buildings,
and yes even on the rooftops.
One was painted blue,
one brown,
some hardly at all.
Some were even found out of compliance in the Alaskan white north. Weve seen them in the desert,
on the DEW line and down under.
The stakes in the debate over global warming are high. If human
activities are causing a major warming of the earths atmosphere, then actions
to reduce greenhouse gas emissions costing hundreds of billions of dollars
would be necessary.
But how do we know if global warming is a problem if we cant trust
the temperature record?
This report, by meteorologist Anthony Watts, presents the results
of the first-ever comprehensive review of the quality of data coming from the
National Weather Services network of stations. Watts and a team of volunteers
visually inspected and took pictures of more than 850 of these temperature stations. What they found
will shock you:
We found
stations located next to the exhaust fans of air conditioning units, surrounded
by asphalt parking lots and roads, on blistering-hot rooftops, and near
sidewalks and buildings that absorb and radiate heat. We found 68 stations
located at wastewater treatment plants, where the process of waste digestion
causes temperatures to be higher than in surrounding areas.
In fact, we
found that 89 percent of the stations--nearly 9 of every 10--fail to meet the
National Weather Services own siting requirements ...
The conclusion is
inescapable: The U.S. temperature record is unreliable. And since the U.S.
record is thought to be the best in the world, it follows that the global
database is likely similarly compromised and unreliable.
Anthony Watts
IntelliWeather
3008 Cohasset
Road
Chico, CA 95973
Phone 530.899.8434
Fax 530.899.3333
Anthony
Watts is a 25-year broadcast meteorology veteran and currently chief
meteorologist for KPAY-AM radio. He got his start as on-air meteorologist for
WLFI-TV in Lafayette, Indiana and at KHSL-TV in Chico, California. In 1987, he
founded ItWorks - http://www.itworks.com/,
which supplies broadcast graphics systems to hundreds of cable television,
television, and radio stations nationwide. ItWorks supplies custom weather
stations, Internet servers, weather graphics content, and broadcast video
equipment. In 2007, Watts founded SurfaceStations.org, a Web site devoted to
photographing and documenting the quality of weather stations across the U.S.
Digging Deeper
Cycle Climates Change
Climate Reference
Network Site Handbook (Taken offline?)
Climate Skeptic
Global Climate Chaos
Global Cooling
Google Earth
Global Warming, the
Cult of Gaia and "Edidence"
How not to measure
temperature, part 82, Friday the 13th: the Temperature Shelter
NOAA Duck and Cover
Resources
Watts Up With That?
Weather Stations
WBZ Video Report
{Editor: Besides the cooler temperatures overall in my
location (Richland, WA) in 2009, I had to wear a sweater in June, where back
in the '60's, it used to be 120 F. in the shade during the Summer. It boggles the
mind that they don't calibrate before they take readings either, but would
rather marginalize the readings by taking an average of nearby stations and
then fudging the results (applying an adjustment) to match their preconceived
notions of "the world is warming". That is not science. That is
"playing with statistics to fit the model". Whoever allowed them to
use "UHI" and get away with it?
BTW, when we hear the
radio station announcing the temperature, we always factor in that the radio
station is next to the river here in the Great American Desert and it is
consistently 5 degrees off true temp., even if it is the "official"
temperature during the winter.}